
The purpose of this Evidence Page is not to convince you that Climate Change is real, but rather to provide a few pointers to reliable resources, for you to make up your own mind.
There is however scientific consensus – the Earth’s climate is warming and human activity (GHG emissions) are to blame.
“Scientific evidence for warming of the climate system is unequivocal.” – IPCC Intergovernmental Panel on Climate Change
Important 2020/21 UPDATES:
IPCC – AR6 Climate Change 2021: The Physical Science Basis
“Code red for humanity”
August 2021
UN Environment Programme:
Making Peace with Nature (Feb 2021) –
This year “is a make-it or break-it year indeed because the risk of things becoming irreversible is gaining ground every year,” UN Secretary-General Antonio Guterres said. “We are close to the point of no return.” “Without nature’s help, we will not thrive or even survive,”
“It’s not what’s happening to elephants. It’s not what’s happening to climate or sea level rise. It’s all going to impact us.” “In the end it will hit us,” said biologist Thomas Lovejoy, who was a scientific advisor to the report. LINK to CBC article
The Intergovernmental Panel on Climate Change (IPCC) is the United Nations body for assessing the science related to climate change.
AR5 Synthesis Report: Climate Change 2014:
The Synthesis Report (SYR) of the IPCC Fifth Assessment Report (AR5) provides an overview of the state of knowledge concerning the science of climate change, emphasizing new results since the publication of the IPCC Fourth Assessment Report (AR4) in 2007.
Excerpt from, AR5 Synthesis Report (Foreword page V): “The SYR confirms that human influence on the climate system is clear and growing, with impacts observed across all continents and oceans. Many of the observed changes since the 1950s are unprecedented over decades to millennia. The IPCC is now 95 percent certain that humans are the main cause of current global warming. In addition, the SYR finds that the more human activities disrupt the climate, the greater the risks of severe, pervasive and irreversible impacts for people and ecosystems, and long-lasting changes in all components of the climate system. The SYR highlights that we have the means to limit climate change and its risks, with many solutions that allow for continued economic and human development. However, stabilizing temperature increase to below 2°C relative to pre-industrial levels will require an urgent and fundamental departure from business as usual. Moreover, the longer we wait to take action, the more it will cost and the greater the technological, economic, social and institutional challenges we will face.”
Global (click to read more)
Source: NASA GLOBAL CLIMATE CHANGE
- Global Temperature Rise
The planet’s average surface temperature has risen about 1.62 degrees Fahrenheit (0.9 degrees Celsius) since the late 19th century, a change driven largely by increased carbon dioxide and other human-made emissions into the atmosphere.4 Most of the warming occurred in the past 35 years, with the six warmest years on record taking place since 2014. Not only was 2016 the warmest year on record, but eight of the 12 months that make up the year — from January through September, with the exception of June — were the warmest on record for those respective months. 5 - Warming Oceans
The oceans have absorbed much of this increased heat, with the top 700 meters (about 2,300 feet) of ocean showing warming of more than 0.4 degrees Fahrenheit since 1969.6 - Shrinking Ice Sheets
The Greenland and Antarctic ice sheets have decreased in mass. Data from NASA’s Gravity Recovery and Climate Experiment show Greenland lost an average of 286 billion tons of ice per year between 1993 and 2016, while Antarctica lost about 127 billion tons of ice per year during the same time period. The rate of Antarctica ice mass loss has tripled in the last decade.7 - Glacial Retreat
Glaciers are retreating almost everywhere around the world — including in the Alps, Himalayas, Andes, Rockies, Alaska and Africa.8 - Decreased Snow Cover
Satellite observations reveal that the amount of spring snow cover in the Northern Hemisphere has decreased over the past five decades and that the snow is melting earlier.9 - Sea Level Rise
Global sea level rose about 8 inches in the last century. The rate in the last two decades, however, is nearly double that of the last century and is accelerating slightly every year.10 - Declining Arctic Sea Ice
Both the extent and thickness of Arctic sea ice has declined rapidly over the last several decades.11 - Extreme Events
The number of record high temperature events in the United States has been increasing, while the number of record low temperature events has been decreasing, since 1950. The U.S. has also witnessed increasing numbers of intense rainfall events.12 - Ocean Acidification
Since the beginning of the Industrial Revolution, the acidity of surface ocean waters has increased by about 30 percent.13,14 This increase is the result of humans emitting more carbon dioxide into the atmosphere and hence more being absorbed into the oceans. The amount of carbon dioxide absorbed by the upper layer of the oceans is increasing by about 2 billion tons per year.15,16
References
North America (click to read more)
Source: IPCC AR5 – Chapter 26
- North America’s climate has changed and some societally relevant changes have been attributed to anthropogenic causes.
- Many climate stresses that carry risk—particularly related to severe heat, heavy precipitation, and declining snowpack—will increase in frequency and/or severity in North America in the next decades.
- North American ecosystems are under increasing stress from rising temperatures, carbon dioxide (CO2) concentrations, and sea levels, and are particularly vulnerable to climate extremes.
- Water resources are already stressed in many parts of North America due to non-climate change anthropogenic forces, and are expected to become further stressed due to climate change.
- Effects of temperature and climate variability on yields of major crops have been observed. Projected increases in temperature, reductions in precipitation in some regions, and increased frequency of extreme events would result in net productivity declines in major North American crops by the end of the 21st century without adaptation, although the rate of decline varies by model and scenario, and some regions, particularly in the north, may benefit.
- Most sectors of the North American economy have been affected by and have responded to extreme weather, including hurricanes,flooding, and intense rainfall.
South America (click to read more)
Source: IPCC AR5 – Chapter 27
- Changes in weather and climatic patterns are negatively affecting human health in CA and SA, by increasing morbidity, mortality,and disabilities, and through the emergence of diseases in previously non-endemic areas.
- With very high confidence,climate-related drivers are associated with respiratory and cardiovascular diseases, vector- and water-borne diseases(malaria, dengue, yellow fever, leishmaniasis, cholera, and other diarrheal diseases), hantaviruses and rotaviruses, chronic kidney diseases, and psychological trauma. Air pollution is associated with pregnancy-related outcomes and diabetes, among others.
- Sea level rise (SLR) and human activities on coastal and marine ecosystems pose threats to fish stocks, corals, mangroves,recreation and tourism, and control of diseases.
- Socioeconomic conditions have improved since AR4; however, there is still a high and persistent level of poverty in most countries,resulting in high vulnerability and increasing risk to climate variability and change.
- Conversion of natural ecosystems is the main cause of biodiversity and ecosystem loss in the region, and is a driver of anthropogenic climate change.
- Land use change contributes significantly to environmental degradation, exacerbating the negative impacts of climate change.
- Changes in streamflow and water availability have been observed and projected to continue in the future in CA and SA, affecting already vulnerable regions.
Europe (click to read more)
Source: European Environmental Agency (EEA)
EEA Global and European temperature Report
“Climate change is happening now and will get worse in the future, even if global efforts to reduce emissions prove effective. Extreme weather and climate-related events that result in hazards such as floods and droughts will become more frequent and intense in many regions. This leads to many adverse impacts on ecosystems, economic sectors, and human health and well-being. Therefore, actions to adapt to the impacts of climate change are paramount and should be tailored to the specific circumstances in different parts of Europe. “
- The average annual temperature for the European land area for the last decade (2009–2018) was between 1.6 °C and 1.7 °C above the pre-industrial level, which makes it the warmest decade on record. In Europe, 2018 was among three warmest years on record.
- Climate models project further increases in global average temperature over the 21st century (for the period 2081–2100 relative to 1986–2005) of between 0.3 °C and 1.7 °C for the lowest emissions scenario (Representative Concentration Pathway (RCP) 2.6) and between 2.6 °C and 4.8 °C for the highest emissions scenario (RCP8.5).
- Annual average land temperature over Europe is projected to increase by the end of this century (2071–2100 relative to 1971–2000) in the range of 1.0 °C to 4.5 °C under RCP4.5, and 2.5 °C to 5.5 °C under RCP8.5, which is more than the projected global average increase. The strongest warming is projected across north-eastern Europe and Scandinavia in winter and southern Europe in summer.
- The number of warm days (those exceeding the 90th percentile threshold of a baseline period) have doubled between 1960 and 2018 across the European land area.
- Europe has experienced several extreme heat waves since 2000 (2003, 2006, 2007, 2010, 2014, 2015, 2017 and 2018). Under a high emissions scenario (RCP8.5), extreme heat waves as strong as these or even stronger are projected to occur as often as every two years in the second half of the 21st century. In southern Europe, they are projected to be particularly strong.
Asia (click to read more)
Source: IPCC AR5 – Chapter 24
- Warming trends and increasing temperature extremes have been observed across most of the Asian region over the past century.
- Terrestrial systems in many parts of Asia have responded to recent climate change with shifts in the phenologies, growth rates,and the distributions of plant species, and with permafrost degradation, and the projected changes in climate during the 21stcentury will increase these impacts.
- Coastal and marine systems in Asia are under increasing stress from both climatic and non-climatic drivers.
- Multiple stresses caused by rapid urbanization, industrialization, and economic development will be compounded by climate change.
- Extreme climate events will have an increasing impact on human health, security, livelihoods, and poverty, with the type and magnitude of impact varying across Asia.
- Water scarcity is expected to be a major challenge for most of the region as a result of increased water demand and lack of good management.
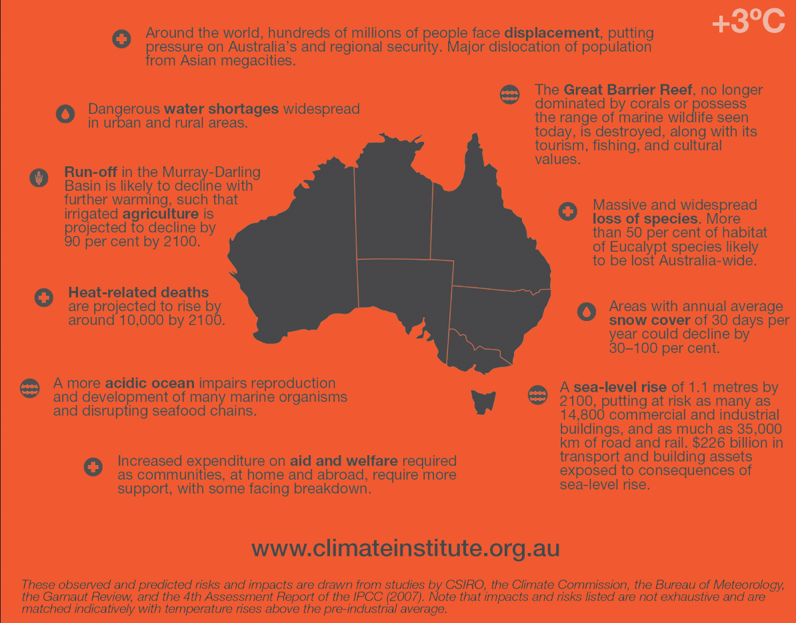
Australia/New Zealand (click to read more)
Source: Climate Institute Australia, Sydney, Australia
Infographic Australia: LINK
New Zealand
Source Ministry for the Environment
Our changing climate will affect our economy, environment and way of life.
Likely impacts of climate change
Higher temperatures
- There is likely to be an increase in demand for air-conditioning systems and therefore electricity in summer.
- People are likely to enjoy the benefits of warmer winters with fewer frosts. However hotter summers will bring increased risks of heat stress and subtropical diseases.
- There may be a reduction in demand for winter heating. This could lead to lower costs and reduced stress on those who cannot afford electricity.
Flooding
- More frequent intense winter rainfalls. These are expected to increase the likelihood of rivers flooding, and flash flooding when urban drainage systems become overwhelmed.
Water resources
- Water demand will increase during hot, dry summers.
- Longer summers with higher temperatures and lower rainfall will reduce soil moisture and groundwater supplies.
- Drought intensity will likely increase over time. Drier conditions in some areas are likely to be coupled with more frequent droughts.
- River flows are likely to be lower in summer and higher in winter.
- Lower river flows in summer will raise water temperatures and aggravate water quality problems (eg, through increased algae growth).
Sea-level rise
- Rising sea levels will increase the risk of erosion, coastal flooding and saltwater intrusion, increasing the need for coastal protection.
Health
- Higher levels of human mortality related to summer heat are expected.
- Higher winter temperatures may lead to a reduction in winter related human mortality and illnesses such as colds and flu.
Biodiversity
- Warmer temperatures will alter habitats that are critical to some species, increasing the risk of localised extinction.
- Warmer temperatures will favour conditions for many exotic species. They will also favour conditions for the spread of disease and pests affecting both fauna and flora.
- Increased summer drought will put stress onto dry lowland forests.
- Earlier springs and longer frost-free seasons could affect the timing of bird egg-laying, first flowering and health of leafing or flowering plants.
Built environment
- Increased temperatures may reduce comfort of people in domestic, commercial and public buildings and could lead to disruptions to business.
Transport
- Hotter summers may damage elements of transport infrastructure, causing buckled railway lines and damaged roads, with disruption and repair costs.
Agriculture
- Agricultural productivity is expected to increase in some areas. However there are risks of drought and spreading of pests and diseases.
- There are likely to be costs associated with changing land-use activities to suit a new climate.
Business and finance
- Households may find it more difficult to access adequate insurance cover in the face of increased flood risk.
- Fruit and vegetable growers may find it more expensive to insure against weather related damage (eg, from hail).
- The risk management of potential climate change impacts may provide opportunities for businesses.
Africa (click to read more)
Source: IPCC-AR5-Chapter5
- Evidence of warming over land regions across Africa, consistent with anthropogenic climate change, has increased.
- Warming projections under medium scenarios indicate that extensive areas of Africa will exceed 2°C by the last 2 decades of this century relative to the late 20th century mean annual temperature and all of Africa under high emission scenarios.
- African ecosystems are already being affected by climate change, and future impacts are expected to be substantial.
- Climate change will amplify existing stress on water availability in Africa.
- Increasing temperatures and changes in precipitation are very likely to reduce cereal crop productivity.This will have strong adverse effects on food security.
- Progress has been achieved on managing risks to food production from current climate variability and near-term climate change but these will not be sufficient to address long-term impacts of climate change.
- Funding and technology transfer and support is needed to both address Africa’s current adaptation deficit and to protect rural and urban livelihoods, societies, and economies from climate change impacts at different local scales.
- Climate change and climate variability have the potential to exacerbate or multiply existing threats (note: violent conflicts) to human security including food, health, and economic insecurity, all being of particular concern for Africa. (
- Key regional risks relating to shifts in biome distribution, loss of coral reefs, reduced crop productivity, adverse effects on livestock, vector- and water-borne diseases, under nutrition, and migration are assessed as either medium or high for the present under current adaptation, reflecting Africa’s existing adaptation deficit.
- Funding and technology transfer and support is needed to both address Africa’s current adaptation deficit and to protect rural and urban livelihoods, societies, and economies from climate change impacts at different local scales.
- Climate change combined with other external changes (environmental, social, political,technological) may overwhelm the ability of people to cope and adapt, especially if the root causes of poverty and vulnerability are not addressed.
Source of information below: United States Environmental Protection Agency (EPA) – Data LINK
Global Emissions by Economic Sector
Global greenhouse gas emissions can also be broken down by the economic activities that lead to their production.[1]
 Source: IPCC (2014); Exit based on global emissions from 2010. Details about the sources included in these estimates can be found in the Contribution of Working Group III to the Fifth Assessment Report of the Intergovernmental Panel on Climate Change. Exit
- Electricity and Heat Production (25% of 2010 global greenhouse gas emissions): The burning of coal, natural gas, and oil for electricity and heat is the largest single source of global greenhouse gas emissions.
- Industry (21% of 2010 global greenhouse gas emissions): Greenhouse gas emissions from industry primarily involve fossil fuels burned on site at facilities for energy. This sector also includes emissions from chemical, metallurgical, and mineral transformation processes not associated with energy consumption and emissions from waste management activities. (Note: Emissions from industrial electricity use are excluded and are instead covered in the Electricity and Heat Production sector.)
- Agriculture, Forestry, and Other Land Use (24% of 2010 global greenhouse gas emissions): Greenhouse gas emissions from this sector come mostly from agriculture (cultivation of crops and livestock) and deforestation. This estimate does not include the CO2 that ecosystems remove from the atmosphere by sequestering carbon in biomass, dead organic matter, and soils, which offset approximately 20% of emissions from this sector.[2]
- Transportation (14% of 2010 global greenhouse gas emissions): Greenhouse gas emissions from this sector primarily involve fossil fuels burned for road, rail, air, and marine transportation. Almost all (95%) of the world’s transportation energy comes from petroleum-based fuels, largely gasoline and diesel.
- Buildings (6% of 2010 global greenhouse gas emissions): Greenhouse gas emissions from this sector arise from onsite energy generation and burning fuels for heat in buildings or cooking in homes. (Note: Emissions from electricity use in buildings are excluded and are instead covered in the Electricity and Heat Production sector.)
- Other Energy (10% of 2010 global greenhouse gas emissions): This source of greenhouse gas emissions refers to all emissions from the Energy sector which are not directly associated with electricity or heat production, such as fuel extraction, refining, processing, and transportation.
Note on emissions sector categories.
Global Emissions by Gas
At the global scale, the key greenhouse gases emitted by human activities are:
 Source: IPCC (2014) Exit based on global emissions from 2010. Details about the sources included in these estimates can be found in the Contribution of Working Group III to the Fifth Assessment Report of the Intergovernmental Panel on Climate Change. Exit
- Carbon dioxide (CO2): Fossil fuel use is the primary source of CO2. CO2 can also be emitted from direct human-induced impacts on forestry and other land use, such as through deforestation, land clearing for agriculture, and degradation of soils. Likewise, land can also remove CO2 from the atmosphere through reforestation, improvement of soils, and other activities.
- Methane (CH4): Agricultural activities, waste management, energy use, and biomass burning all contribute to CH4 emissions.
- Nitrous oxide (N2O): Agricultural activities, such as fertilizer use, are the primary source of N2O emissions. Fossil fuel combustion also generates N2O.
- Fluorinated gases (F-gases): Industrial processes, refrigeration, and the use of a variety of consumer products contribute to emissions of F-gases, which include hydrofluorocarbons (HFCs), perfluorocarbons (PFCs), and sulfur hexafluoride (SF6).
Black carbon is a solid particle or aerosol, not a gas, but it also contributes to warming of the atmosphere. Learn more about black carbon and climate change on our Causes of Climate Change page.
Trends in Global Emissions
 Source: Boden, T.A., Marland, G., and Andres, R.J. (2017). Global, Regional, and National Fossil-Fuel CO2Emissions. Carbon Dioxide Information Analysis Center, Oak Ridge National Laboratory, U.S. Department of Energy, Oak Ridge, Tenn., U.S.A. doi 10.3334/CDIAC/00001_V2017.Global carbon emissions from fossil fuels have significantly increased since 1900. Since 1970, CO2 emissions have increased by about 90%, with emissions from fossil fuel combustion and industrial processes contributing about 78% of the total greenhouse gas emissions increase from 1970 to 2011. Agriculture, deforestation, and other land-use changes have been the second-largest contributors.[1]
Emissions by Country
 Source: Boden, T.A., Marland, G., and Andres, R.J. (2017). National CO2 Emissions from Fossil-Fuel Burning, Cement Manufacture, and Gas Flaring: 1751-2014, Carbon Dioxide Information Analysis Center, Oak Ridge National Laboratory, U.S. Department of Energy, doi 10.3334/CDIAC/00001_V2017.In 2014, the top carbon dioxide (CO2) emitters were China, the United States, the European Union, India, the Russian Federation, and Japan. These data include CO2 emissions from fossil fuel combustion, as well as cement manufacturing and gas flaring. Together, these sources represent a large proportion of total global CO2 emissions.
Emissions and sinks related to changes in land use are not included in these estimates. However, changes in land use can be important: estimates indicate that net global greenhouse gas emissions from agriculture, forestry, and other land use were over 8 billion metric tons of CO2 equivalent,[2] or about 24% of total global greenhouse gas emissions.[3] In areas such as the United States and Europe, changes in land use associated with human activities have the net effect of absorbing CO2, partially offsetting the emissions from deforestation in other regions.
References
1. IPCC (2014). Climate Change 2014: Mitigation of Climate Change . Exit Contribution of Working Group III to the Fifth Assessment Report of the Intergovernmental Panel on Climate Change [Edenhofer, O., R. Pichs-Madruga, Y. Sokona, E. Farahani, S. Kadner, K. Seyboth, A. Adler, I. Baum, S. Brunner, P. Eickemeier, B. Kriemann, J. Savolainen, S. Schlömer, C. von Stechow, T. Zwickel and J.C. Minx (eds.)]. Cambridge University Press, Cambridge, United Kingdom and New York, NY, USA.
2. FAO (2014). Agriculture, Forestry and Other Land Use Emissions by Sources and Removals by Sinks.(89 pp, 3.5 M, About PDF) Exit Climate, Energy and Tenure Division, FAO.
3. IPCC (2014): Climate Change 2014: Synthesis Report. Contribution of Working Groups I, II and III to the Fifth Assessment Report of the Intergovernmental Panel on Climate Change.(80 pp, 4.2 M, About PDF) Exit [Core Writing Team, R.K. Pachauri and L.A. Meyer (eds.)]. IPCC, Geneva, Switzerland, 151 pp.